Despite facing a challenging period in recent months, the price of Litecoin has demonstrated a significant upward trajectory. In June, LTC experienced a decline
Despite facing a challenging period in recent months, the price of Litecoin has demonstrated a significant upward trajectory. In June, LTC experienced a decline to $71; however, the bulls subsequently took charge and initiated a recovery.
Nevertheless, over the past week, LTC’s progress slowed, with the coin retracing below the $100 mark and experiencing a loss of approximately 12%. On the daily chart, LTC witnessed a 1.5% decline.
Although the coin experienced a significant devaluation on the weekly chart, the bullish sentiment remains. The technical analysis of Litecoin indicates that the bulls are currently dominant, with a minor retracement in demand and accumulation.
As Bitcoin also retraced on its chart recently, other altcoins, including Litecoin, observed depreciation. Currently, Litecoin is in a crucial price zone ranging from $90 to $94. Sustaining a price above the $94 mark is expected to provide impetus for LTC to resume its upward trajectory. The market capitalization of LTC reflects a higher presence of sellers compared to buyers in the market.
Litecoin Price Analysis: One-Day Chart
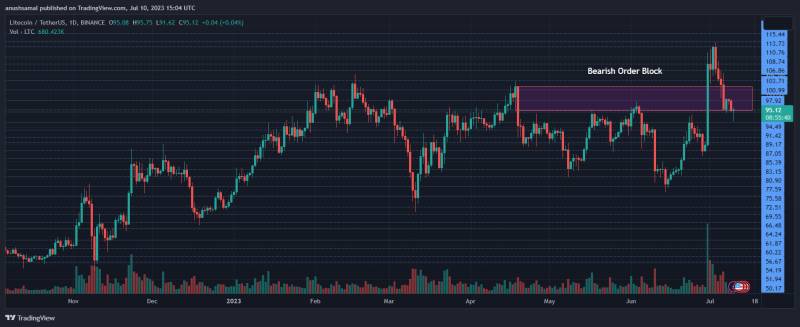
Litecoin was priced at $95 on the one-day chart | Source: LTCUSD on TradingView
LTC has experienced notable capital inflows, indicating that investor interest has remained positive, as evidenced by the Chaikin Money Flow indicator.
This indicates a sustained bullish outlook on the chart. Furthermore, the Bollinger Bands, which reflect price volatility and fluctuation, are currently wide open. This suggests that LTC may undergo significant price action and volatility in the upcoming trading sessions.
source:newsbtc


 Tue, 18 Apr 2023