Furthermore, Dogecoin has formed a pattern indicating a potential trend reversal, which could further increase bullish momentum. However, it is important to not
Furthermore, Dogecoin has formed a pattern indicating a potential trend reversal, which could further increase bullish momentum. However, it is important to note that a price pullback is still possible despite this pattern.
The coin must remain above the two vital price levels to continue its upward trend. Currently, Dogecoin remains stuck under a crucial resistance mark.
Dogecoin Price Analysis: One-Day Chart
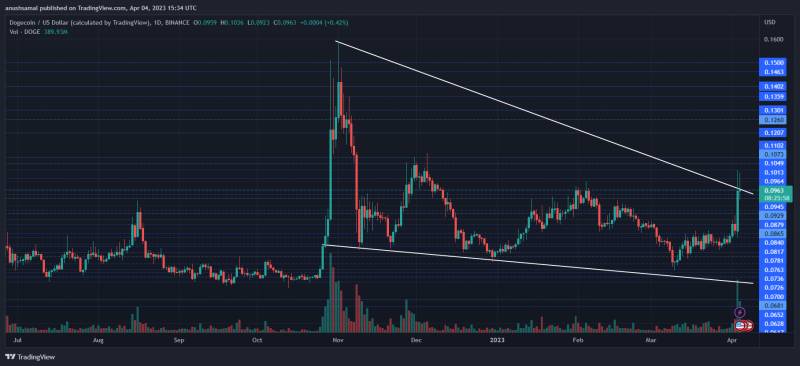
Dogecoin was priced at $0.096 on the one-day chart | Source: DOGEUSD on TradingViewTechnical Analysis
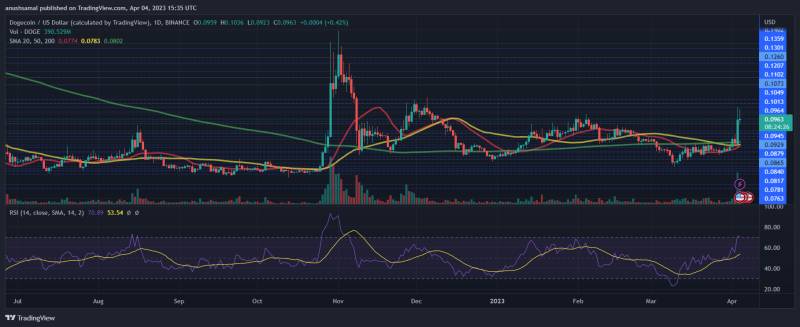
Dogecoin was overbought on the one-day chart | Source: DOGEUSD on TradingView
Buying strength of DOGE witnessed a sharp surge, causing the asset to become overbought and overvalued at the time of writing. This was indicated by the Relative Strength Index (RSI) standing above 70, a signal for an overbought asset.
Typically, after being overbought, the asset’s price tends to undergo a significant pullback. Likewise, Dogecoin moved above the 20-Simple Moving Average (SMA) line. This signified that buyers were driving the price momentum in the market.
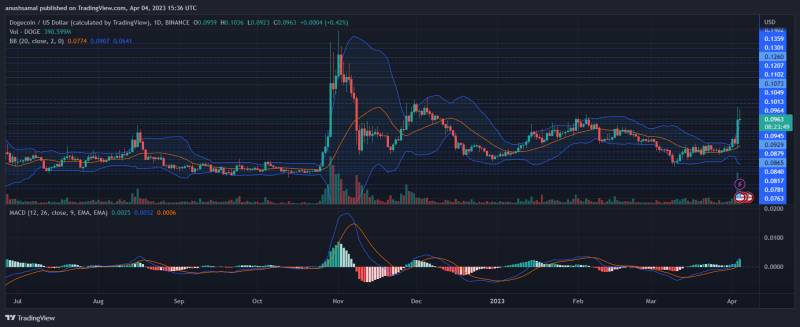
Dogecoin formed buy signals on the one-day chart | Source: DOGEUSD on TradingView
With the increase in demand, other technical indicators have also aligned with the bulls. The Moving Average Convergence Divergence (MACD), which indicates price trends and reversals, turned green with growing green signal bars tied to buy signals for the coin at the time of writing.
Bollinger Bands also opened up significantly, indicating that the possibility of price volatility and fluctuation cannot be ignored.
source:newsbtc


 Tue, 18 Apr 2023