The demand for SOL must increase in the immediate trading sessions, or accumulation may decline. Despite the indicators not fully favouring the bulls, SOL has t
The demand for SOL must increase in the immediate trading sessions, or accumulation may decline. Despite the indicators not fully favouring the bulls, SOL has the potential to rise above its immediate trading sessions if it remains above local support.
The SOL bulls must overcome two critical resistance levels for the price to continue rising. Broader market strength is also crucial for the asset. The market capitalization has also seen an uptick, indicating the presence of buyers in the market.
Solana Price Analysis: One-Day Chart
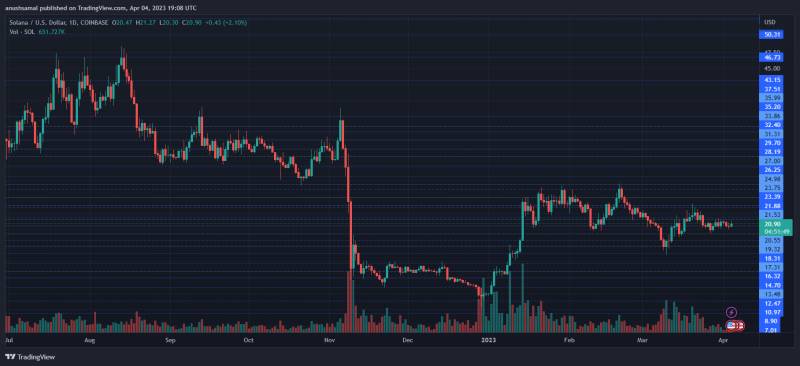
Solana was priced at $20.90 on the one-day chart | Source: SOLUSD on TradingView
SOL was trading at $20.90 at the time of writing. The recent price appreciation allowed the bulls to break through a crucial resistance level and turn it into support. The overhead resistance for the altcoin was $21.50, and if breached, SOL could encounter another resistance at $23.40.
Successfully surpassing $23.40 could drive SOL to $26. Conversely, the first line of support for the altcoin was at $19.30, and failing to remain above it could cause SOL to trade close to the $18 mark. The amount of Solana traded in the last session turned green indicating an influx of buying strength on the one-day chart.
Technical Analysis
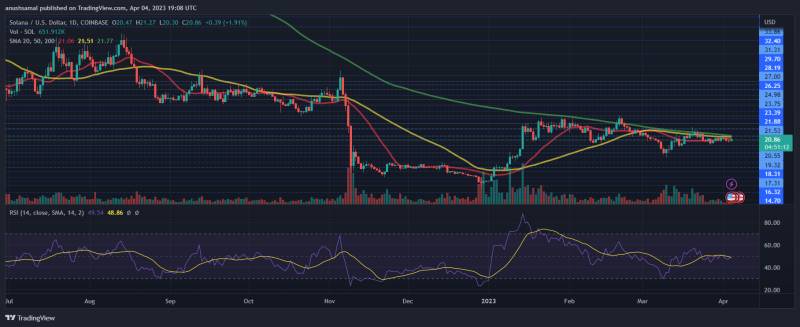
Solana registered a small uptick in buying strength on the one-day chart | Source: SOLUSD on TradingView
Although buyers were still trying to establish their position in the market, SOL was not entirely bullish. The Relative Strength Index showed a slight uptick but remained slightly below the half-line, indicating that there were more sellers than buyers.
Additionally, the price of SOL was below the 20-Simple Moving Average, indicating that demand was still low and sellers were driving the price momentum in the market.
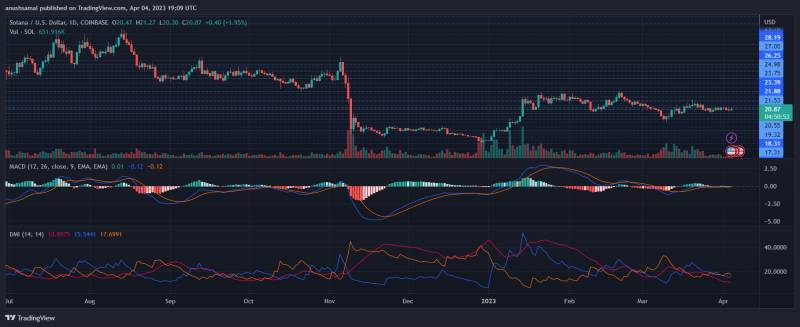
Solana depicted a sell signal on the one-day chart | Source: SOLUSD on TradingView
source:newsbtc


 Tue, 18 Apr 2023